Home
/
Case Studies
/
The Forward Bar

The Forward Bar: four months of a CRO program
The Forward Bar: four months of a CRO program
+40% conversion rate and +57% revenue per session, comparing March to May with June to September 2026
Client
The Forward Bar
Industry
Food & beverage, DTC and subscription on Shopify
Analytics Snapshot
Four months (late May to September 2026)
Project type
CRO program, before/after trend (A/B tests and site changes combined)

FollowThru started working with The Forward Bar in late May 2026. From March through May, the site converted 3.0% of sessions. From June through September it averaged 4.25%, and every one of those months beat the site's previous best (3.8% in February).

‍

Revenue per session rose 57%. Between June and September, sessions fell 10% while orders rose 21% and revenue rose 18%.

‍

The returning customer rate was 15 to 20% in spring and 39% in September. Subscription and repeat orders grew faster than first orders.

‍

Conversion rate stayed at 4% or higher for four straight months while the business grew.

The problem

Paid traffic was growing, but the site converted about 3 in 100 sessions. With 80% of visits on mobile, shoppers had to work to find the bars and work again to learn what they were buying.

‍

The insight

The visitors who reached the product were interested. Products sat below the homepage fold, the product page's first mobile screen named the brand but not the bar, and the mobile menu wasn't built around what the store sells. Each step lost people who were ready to buy.

‍

Example changes

We audited the site and its tracking, ranked fixes by impact and effort, then tested and shipped them one at a time:

  • Homepage
  • Product page
  • Mobile menu
  • Data & research
Outcomes & Impact
+40%
Conversion rate, from 3.0% to 4.25% (monthly average)
+57%
Revenue per session
2x
Returning customer rate: 15 to 20%, now 39%
+21%
Orders on 10% less traffic, June to September
Want to see what FollowThru can do for you? Schedule a free strategy call.
Monthly conversion rate, 2026
3.0% → 4.25%
Before
With FollowThru
0%2%4% FollowThru starts, late MayFollowThru startslate May Mar to May avg 3.0% Jun to Sep avg 4.25% 3.8%4.0%4.4% FebMarAprMayJunJulAugSep
Source: Shopify Analytics.

Some tests behind it

ChangeResult
Product page: real title and four proof lines above the fold+30% conversion rate
(96.7% confidence);
+38.4% revenue per session
Mobile menu built around the products+20.42% conversion rate
(91.7% confidence)
Homepage: products moved directly under the hero+36% purchases
(from 1.1% to 1.5% of homepage sessions)
Pricing guide requests by page, first two weeks
+111% vs the original page
Source: site analytics, October 2026. Different traffic sources, so not a controlled test.
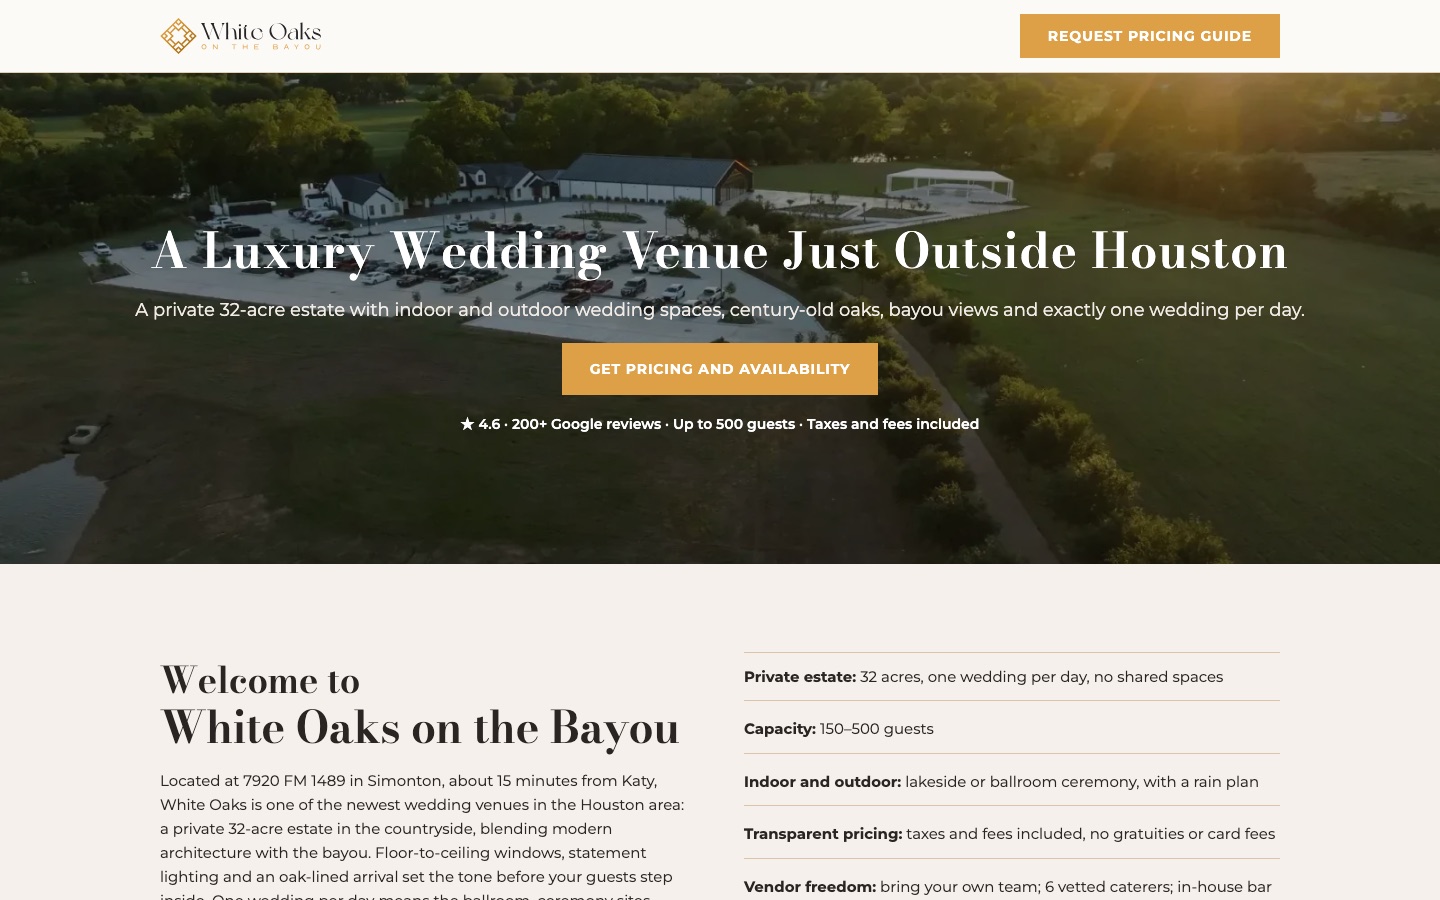
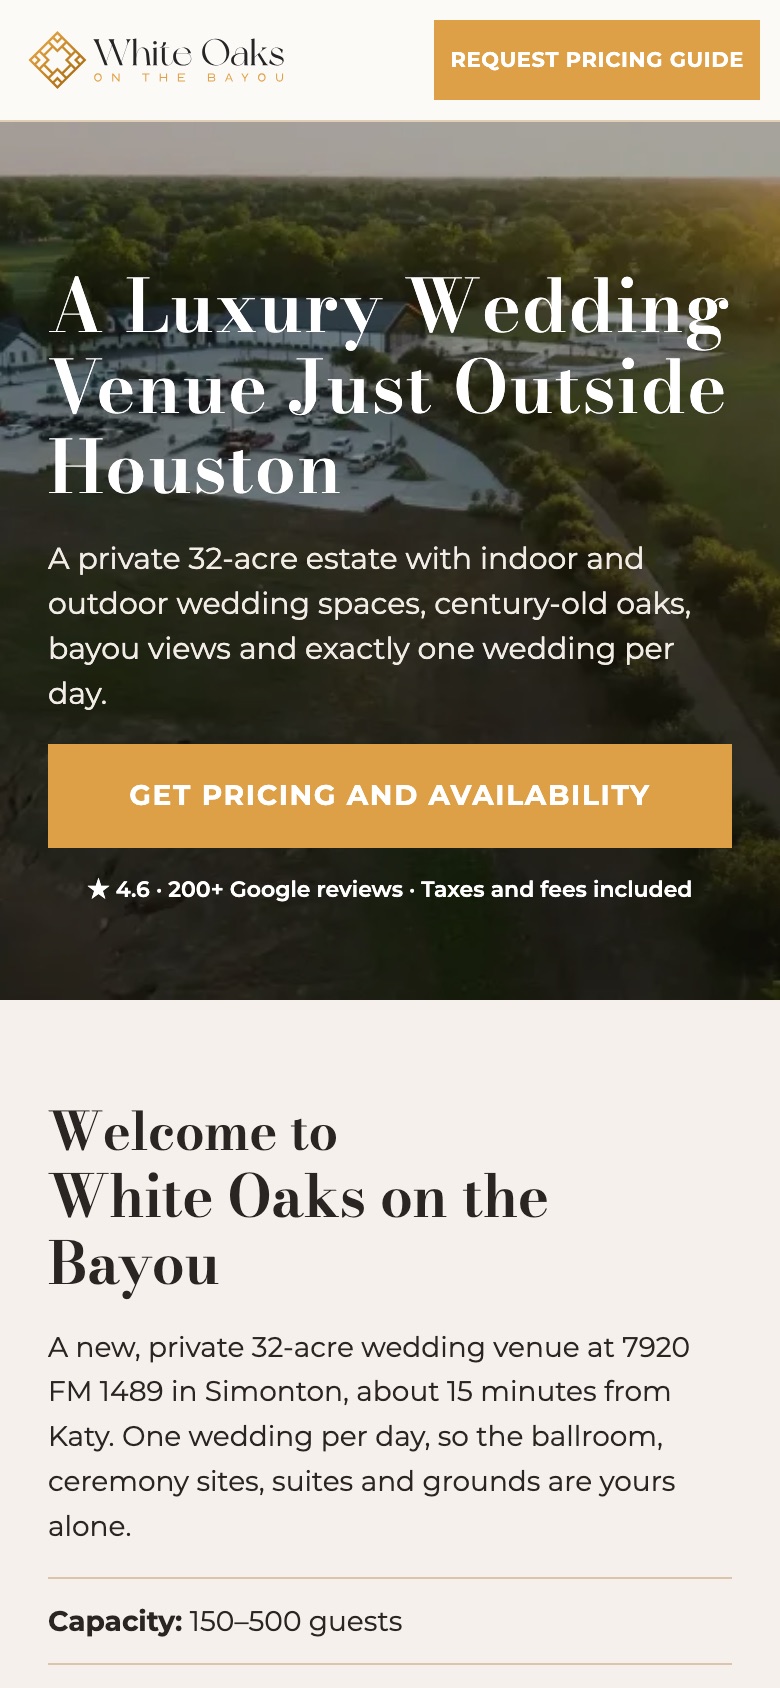
Mobile view of the new Houston wedding venue landing page

What we built and what we saw

ChangeResult
Conversion tracking: lead and appointment events on every pagePages compared on the same terms for the first time
Pricing and availability button in the hero#1 tapped element on mobile
Photo tour of every spaceMost attention on the page (attention map)
FAQs on dates and reserving oneMost FAQ taps on date availability and reserving a date

Let’s Talk

Follow us
What we offer
Buyer Journey Audit
Conversion Tracking Setup
Landing Pages
CRO Program
Get a free strategy call.
Share your information and we'll walk through how we'd approach your site together.
Thanks! Our team will get back to you within one business day.
Submission failed. Please try again in a moment.